Correct number formatting makes reports easier to read, improves consistency, and helps users trust the data they are seeing. In IBM Planning Analytics, formatting is controlled through dimension attributes. This means you can apply formats across multiple elements quickly, rather than changing individual reports one by one.
In this guide, we show how to update the formats of data elements efficiently.
Why formatting matters #
Without consistent formatting, users may see:
- Values displayed with too many decimal places
- Percentages shown as whole numbers
- Currency values without symbols or separators
- Different formats for similar data items
Applying the correct format at element level helps standardise reporting across the model.
How to update formats for multiple elements #
You can quickly set formats for several elements at the same time using the dimension editor.
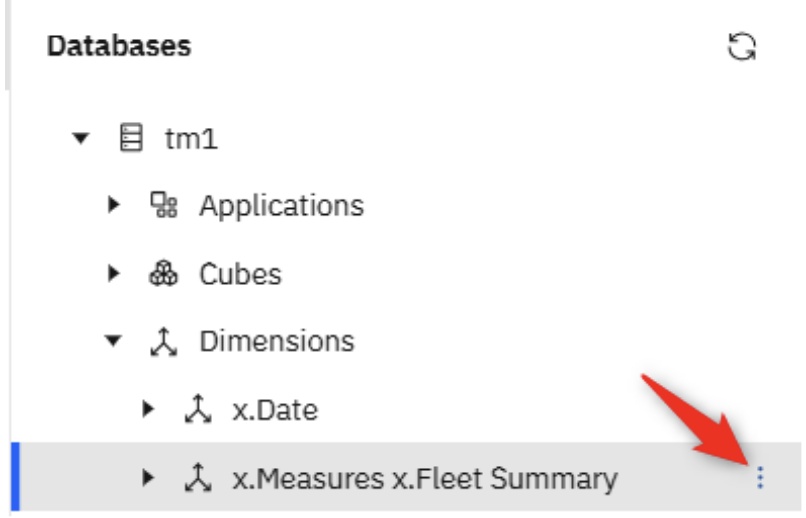
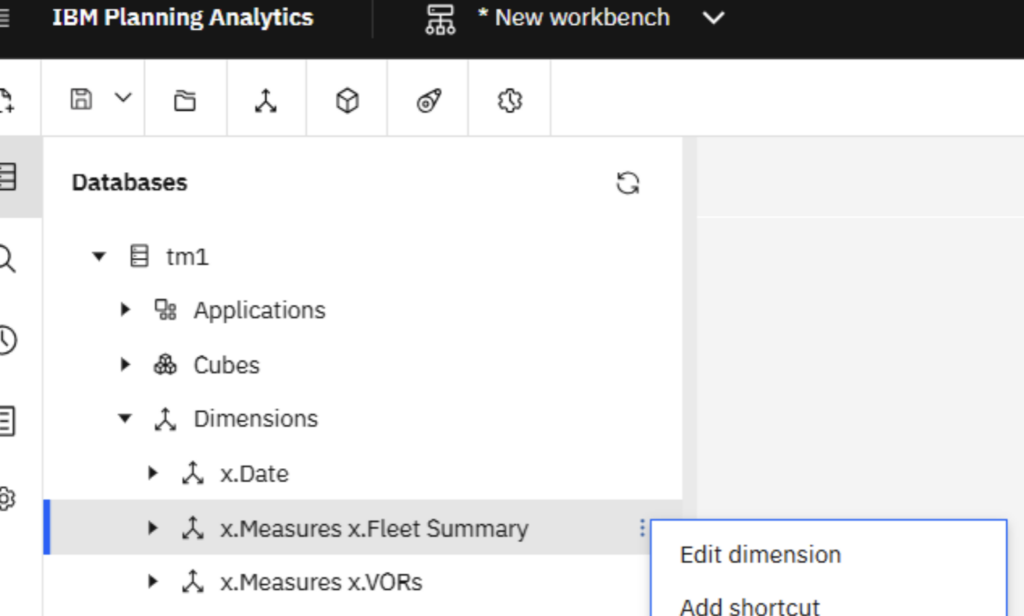
Step 1: Open the dimension #
Navigate to the dimension containing the data elements you want to update and open it in edit mode either by clicking on the ellipsis (3 dots) next to the name or by right mouse clicking on the dimension and selecting ‘Edit Dimension’, as below:
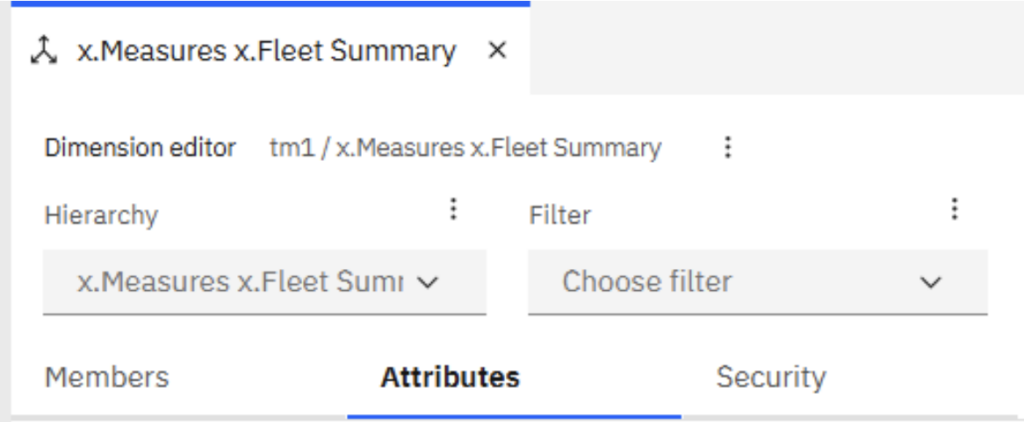
Step 2: Locate the Format attribute column #
Once the dimension is open, click on ‘Attributes’ tab
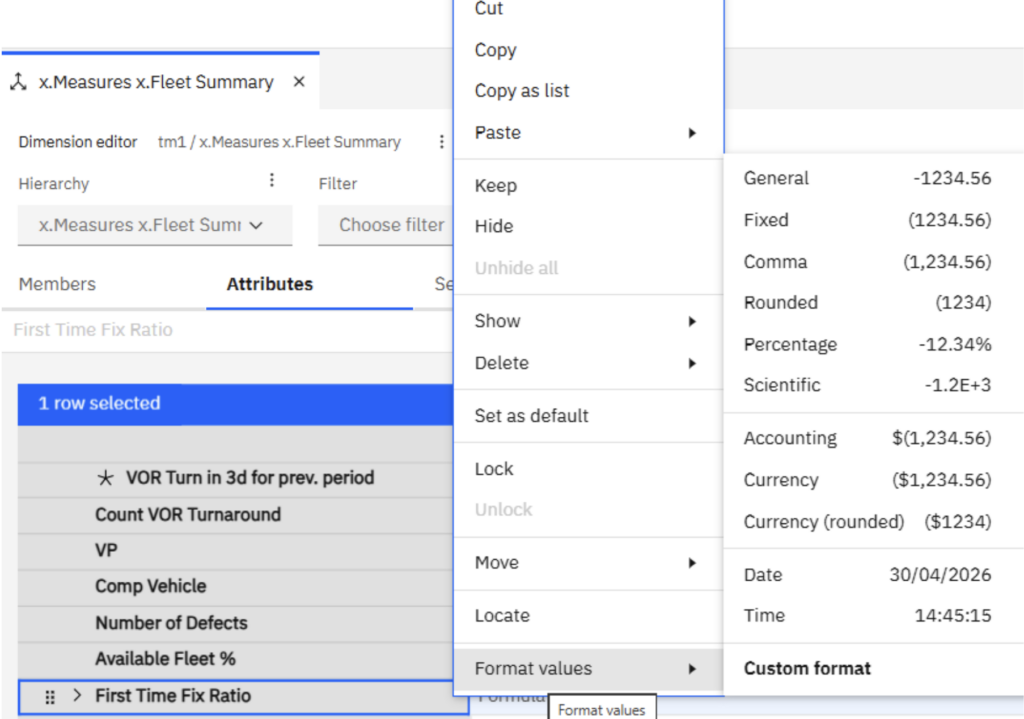
Select the Row in question, and then either ‘Right Mouse Click’ on it, or select the ellipsis button on the top blue tool bar…
![]()
…and select, ‘Format Values’, as below:
 #
#
Step 3: Select the formatting options #
You can then choose from standard format types or create a custom format.
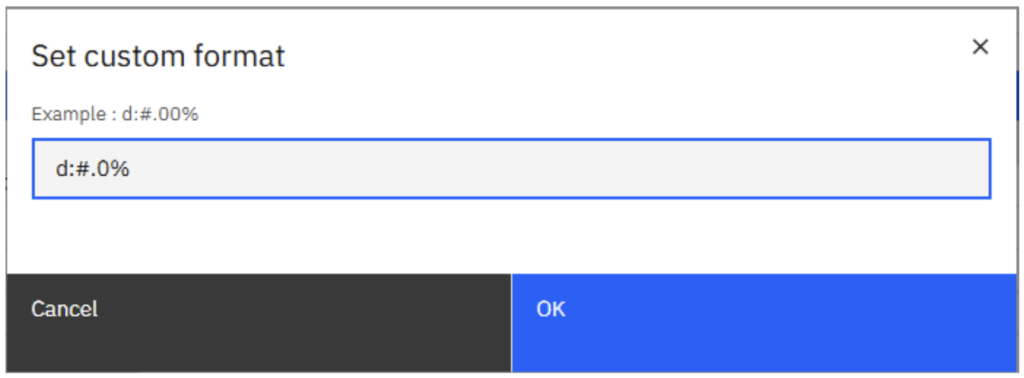
In our example, we’ve selected ‘Custom Format’.
Enter a Custom Format, and click on OK when finished:
The format will now be visible within the ‘Format’ Column of the attribute:

Using custom formats #
If you need more control, choose Custom format.
This is useful for:
- Specific decimal places
- Bracketed negatives
- Currency with symbols
- Thousand separators
- Bespoke reporting layouts
Updating individual elements #
Once the main formats are applied, you can still override specific elements where needed. This is helpful when one measure needs to display differently from the rest.
Benefits of formatting at source #
Applying formats in the model rather than in Excel reports helps ensure:
- Consistent outputs across reports
- Faster report creation
- Less manual formatting work
- Better user experience
Final thought #
Formatting is often overlooked, but it can make a major difference to how professional and usable a Planning Analytics solution feels. If you need more help to create clear and consistent reports, talk to us, we are always happy to help.


