5 Top Tips for Working with Planning Analytics for Excel (PAfE) #
If you use IBM Planning Analytics for Excel (PAfE) regularly, you’ll know just how powerful it is, and how many handy tricks there are to make life easier.
The Excel add-in is packed with functionality for data exploration and reporting. In this short guide, I’ll share five of our favourite tips to help you get more out of the Cube Viewer in Planning Analytics for Excel.
1. How to create Sandbox: #
A sandbox is a personal copy of your database where you can test changes without affecting the main (base) data. It’s ideal for trying out “what-if” scenarios safely.
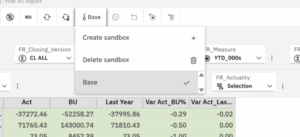
How to create a sandbox:
-
Click the ‘Base’ then create sandbox
-
Give your sandbox a name.
-
Choose whether to start from the base data or copy an existing sandbox.
-
Click OK.
You can switch between sandboxes using the drop-down list at the top. When you’re happy with your changes, click Commit data to make them live.
To delete a sandbox, go to Sandbox → Delete Sandbox, select the one you want to remove, and click Delete.
💡 Tip: Sandboxes are visible only to you until you commit them, which makes them a safe space to experiment!
2. Show Values as Percentages #
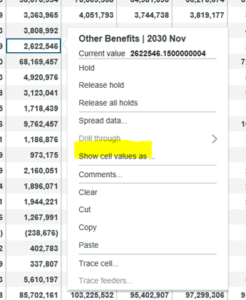
Need a quick way to see proportions or compare performance? The Show cell value as… option helps you view data as percentages of rows, columns, or totals.
How to use it:
-
Right-click a cell and select Show cell value as…
-
Choose from:
-
% Row Total – values as a percentage of each row total
-
% Column Total – values as a percentage of each column total
-
% Grand Total – values as a percentage of all data points
-
To go back to normal values, simply choose As-is.
3. Hide Columns and Rows #
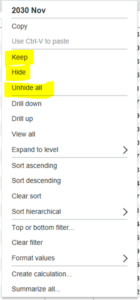
Sometimes less is more. If you want a cleaner view or are building an asymmetric report, you can quickly hide or keep only certain rows or columns.
To hide or keep rows/columns:
-
Select one or more rows or columns.
-
Right-click and choose either:
-
Hide – hides the selected items.
-
Keep – hides everything except the selected items.
-
To restore all, right-click and select Unhide all.
4. Do the Maths (Member and Summary) #
Need a quick calculation? In Cube Viewer, you can now create member or summary calculations.
Member calculations
Member calculation will create results of calculation between two members selected.
Below you can select Act and BU, column, right click then select ‘Calculation’ then ‘Member Calculation’
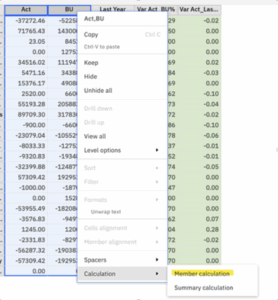
Name the calculation then select type of calculation
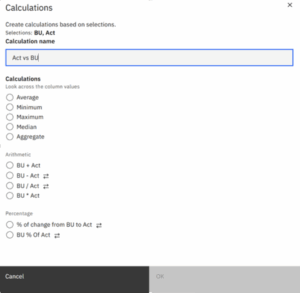
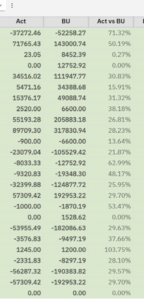
Calculation will be displayed as a new column
Summary calculation
Similar to member calculation, when you select two members, you can also create a new column containing ‘summary’ .
To create summary calculations, select two members then select ‘summary calculations’. Give the new column a name and select the calculation options:
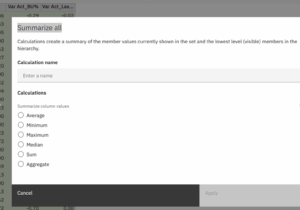
5. Summarise It for Me #
When you’re working with lots of data, summaries are your friend. PAfE can instantly generate summary rows or columns for visible data.
How to summarise:
-
Select the rows or columns you want to summarise.
-
Right-click and choose Summarize all.
-
Pick your preferred summary type (e.g. sum, average, max, min).
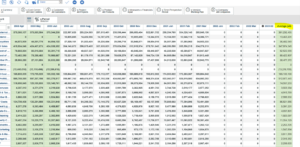
PAfE will insert a new row or column showing the result.
Final Thought #
There are plenty more features worth exploring in Planning Analytics for Excel.
Try these five out next time you’re in the Cube Viewer and see how much faster your analysis becomes.
And if you’ve got a favourite PAfE trick of your own, we’d love to hear it!
💬 Got a question or want to see how we can help your business get more from IBM Planning Analytics?
Contact us today for expert advice.


