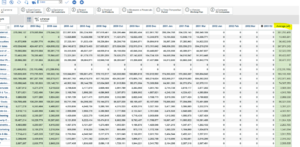
Planning Analytics for Excel has many functions for data analysis within the cube viewer. In this article we’ll show you the top 5 tips function useful for analysis. #
A quick note – to perform any analysis, you will need to connect to your database and open cube viewer.
Use sandboxes to play with different scenarios #
A Sandbox is a copy of your database, and can be used to create multiple scenarios without impacting your base data.
To create a sandbox, click and tap ‘Create sandbox’

Name the sandbox, then choose whether you want to create a sandbox from the base data or to create a copy of an existing sandbox, and then click OK.
You can now work in the sandbox. You can move between different sandboxes by selecting them from the drop-down list.
When you are satisfied with the data in a sandbox, and you want to commit it to the base, click Commit data.
To delete a sandbox, follow these steps.
- Sandbox, Select Delete sandbox, select the sandbox that you want to remove, and tap Delete.
Use show cell values as… #
Show cell values as can be useful if you want to see percentage of cell values in relative to it’s total.
To show cell values as a percentage, right-click in a cell, and select ‘Show cell value as’
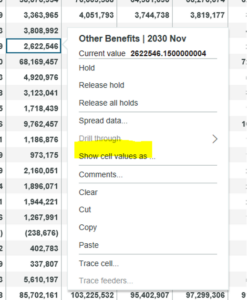
In this menu you can select values displayed as:
% Row total Displays all the values in each row as a percentage of the total for the row.
% Column Total Displays all the values in each column as a percentage of the total for the column.
% Grand Total Displays values as a percentage of the total of all the values or data points in the report.
Advanced – % Parent Row total Displays the values in each row as a percentage of the parent.
Advanced – % Parent Column total Displays the values in each column as a percentage of the parent
To return to the actual cell values, in the Show cell value window, select As-is.
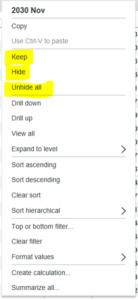
Hide columns and rows #
Columns and rows can be hidden for simpler analysis, or when creating asymmetric views.
To hide columns or rows select or a single or multiple columns or rows, right click and select ‘Hide’ to hide selected column or rows, or select ‘Keep’ to hide unselected column or rows.
To return all hidden columns or rows select ‘unhide all’.
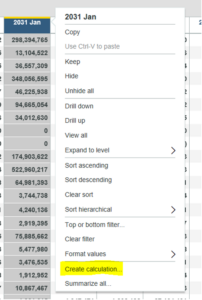
Quick column or rows calculation #
You can quickly calculate values in columns or rows. If you create a column calculation, Cube viewer will create additional columns to store the calculation values. However, this calculation will not be stored in the database, but you can export it as excel reporting.
To create a calculation:
- Select the column or rows header
- Right click and Select ‘Create calculation’
- and select relevant calculation
Selecting single columns or rows allows you to create the following calculations, whilst selecting multiple columns or rows will show different calculations.
- Rank: ranks the value of the cell, with rank 1 being the highest. This applies to visible numeric values only.
- Absolute value: the non-negative value of the cell.
- Percentage (%) of total: the value as a percentage of the total.
- Percentage (%) of parent: the value as a percentage of the immediate parent.
- Quick arithmetical calculation (+,-,/,*)
Summarise all #
Planning Analytics has a smart function if you want to quickly summarise visible columns or rows, which will be created at the end of your view.
To summarise columns or rows:
Select rows or columns
Right click and select Summarise all
Choose summary options:
- Average
- Minimum
- Maximum
- Median
- Sum
- Aggregate
Click OK, the results will be shown at the end of the columns/rows.