What’s new in PAW version 62?
Planning Analytics Workspace version 62 came out overnight on 17th March 2021. Lindsey O’Grady looks at what’s new and reviews the significance of the updates.
Synchronise Parameters for an Action Button that runs a TI process
Action buttons which run a process can now intelligently pre-populate prompts where previously you would have to pick a value from a drop down. They can populate using values already selected within dimension selectors, views and websheets. To do this, you change control type field to ‘synchronised’.
Note: You can’t change the synchronised value as it is greyed out. To that end, you may wish to hide the prompt completely which you can do by unticking ‘Prompt User?’
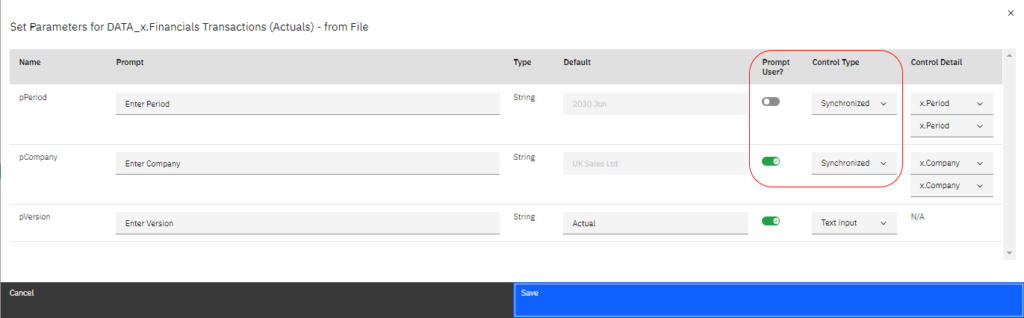
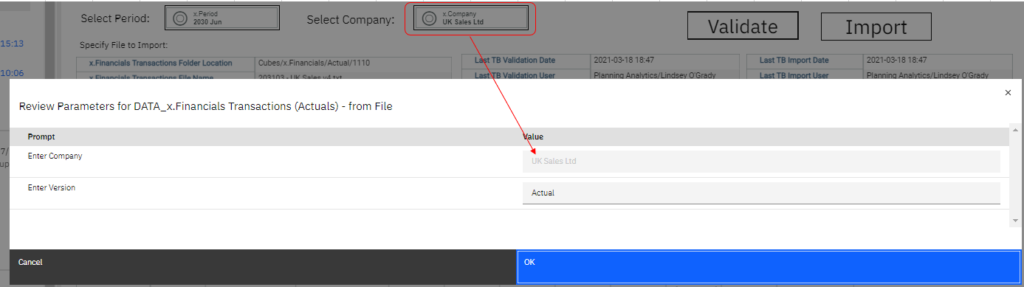
I thought I would start with the most impactful change for me. This is just brilliant. I pretty much started to use this feature the day it came out. There are many cases when I have a cube view filtered for a company or period along with a button on the same page to import the data into that slice of the cube. I really only want to make my company / period selection once (on the cube view or dimension selector). Before now, you would then have to reselect the same company and period on the button prompts. This new feature makes the experience so much slicker.
Seamlessly scroll through all objects in the data tree
In a previous version, IBM placed a limit on the number of objects you could see in the Data Tree, after which there would be an option to ‘Load More’. Now that limit has been removed so all objects in the Data Tree can be seen. Combine that with the search feature and its now much easier to scroll through the tree structure and find objects. For customers with a large number of processes, dimensions and cubes, this update will definitely appeal and allow parity with Architect and the previous PAW experience.
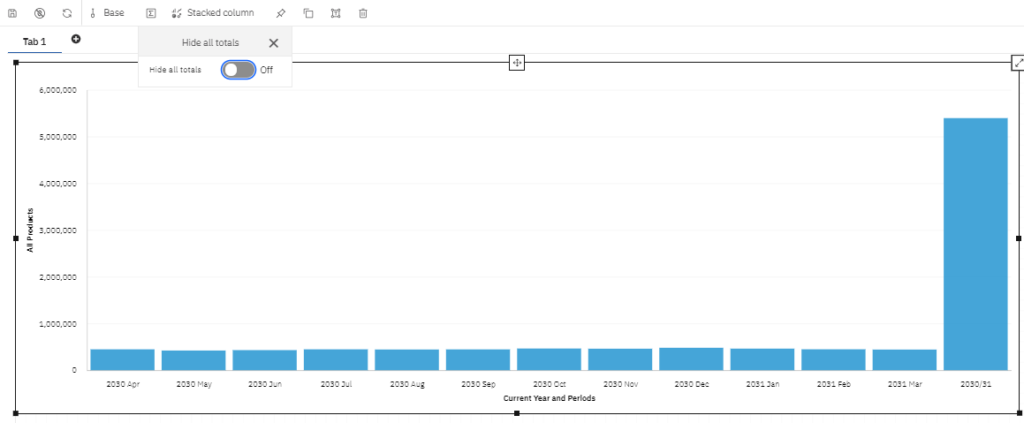
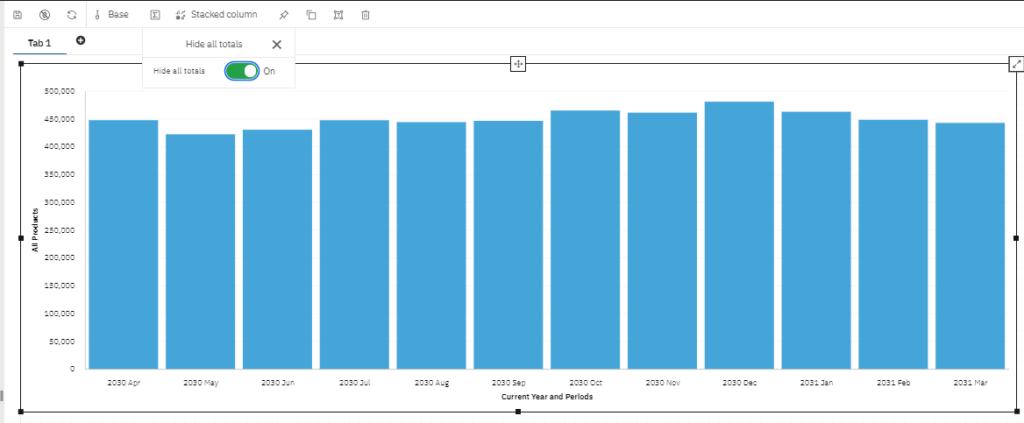
Hide totals in a visualisation
With visualisations, there is now an option to hide all totals.
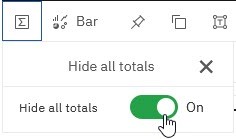
Often when you are creating a visualisation (chart) from a cube view, your view might have had months and year total. After converting that into a chart, the year total skews the display. Before now, you would manually hide the year total to make the chart easier to read. This new option makes it quicker to do as it’s just a simple click.
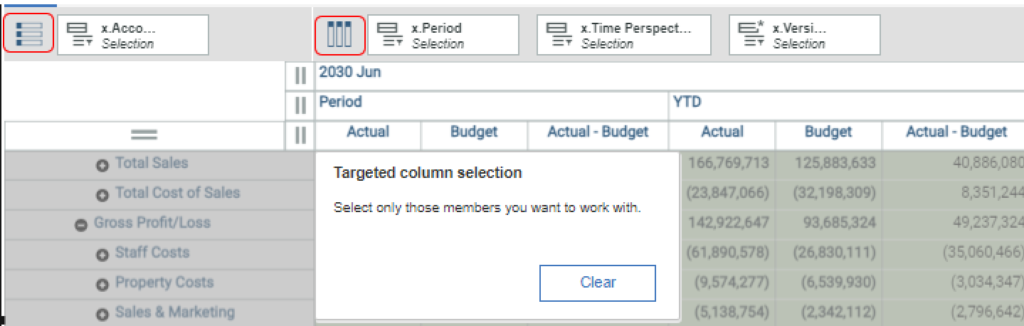
Asymmetric calculations on nested rows
Cube views will now support asymmetric calculations. This means that for nested dimensions you have the option to show a calculation under the single nested set rather than one that is common to all nested sets.
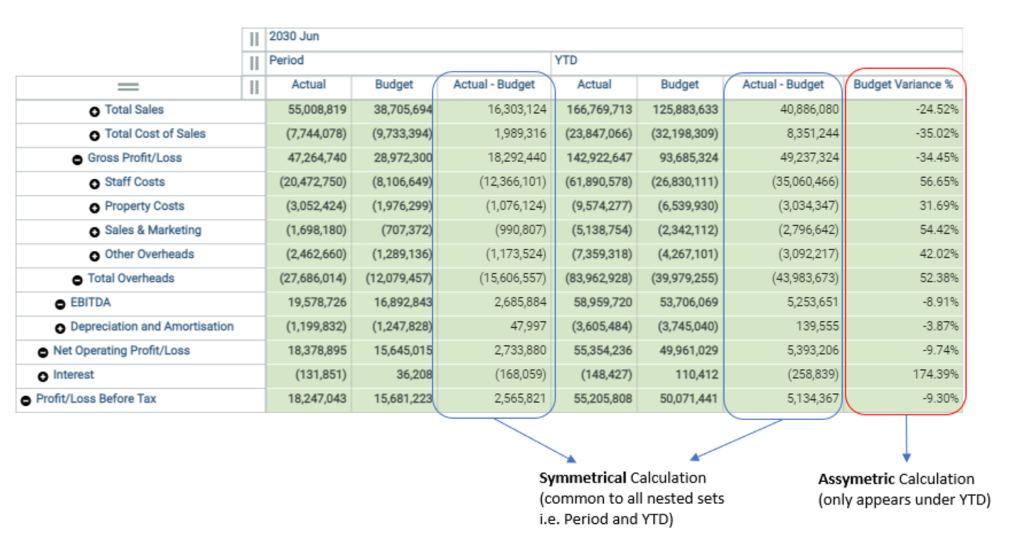
By default, calculations are symmetrically nested. But you can make it asymmetric by clicking on the column or row symbol beforehand.
For context, ‘Calculations’ in PAW are not the same as ‘Rules’. Calculations are simple arithmetic formulas that can be added into the cube view by authors without the need for modelling changes. They are a really useful way to bypass the need to build extra rules. This is particularly relevant where it’s only an ad hoc calculation that isn’t worth adding into the model in the long term. Calculations can also be a way to avoid the risks associated with adding lots of new rules which include increasing the feeders and cube size thereby potentially degrading the cube performance or increasing data loading times.
In my view, it’s great to have more flexibility over the cube view design. Asymmetric nesting is available already but only with elements not calculations. Without flexibility like this, people often dive into Planning Analytics for Excel using a Custom Report to achieve the exact set of columns they are after. With this new feature there will be less cause for that making it quicker/simpler to author.
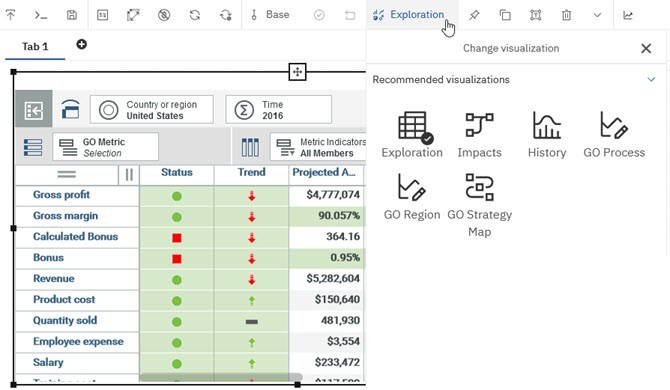
Support for Scorecards
Version 62 now supports converting your views into a Scorecard Visualisation. Scorecards reflect the strategic goals of a business and combine with traffic light status / trend indicators to measure performance against target. These are created using ‘Metric’ cubes designed in a legacy desktop modelling tool called Performance Modeler.
From my experience, Metric cubes aren’t common to most PA customers but it is used in some businesses so this will appeal to companies that want to transition their current scorecards into the newer PAW interface. It remains to be seen if we can create these metric cubes in PAW so that you don’t have to span across multiple modelling tools and whether there is a strong demand for it in the first place.
Percentage Values in Cube Viewer
When double clicking on a value formatted as a percentage in cube viewer, it retains the percentage formatting (e.g. 50%) rather than showing the value as the underlying decimal value (e.g. 0.5).
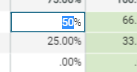
A small improvement to cube viewer! I guess you might double click the cell if the value is a rounded percentage and you’re trying to ascertain what is the exact value including all decimals.
Websheets support more than 1 database on same sheet (local only, not cloud)
In PA Local, you can now use a Websheet which has views that span more than one PA database on the same sheet. There are a few caveats though:
- Applies to just Custom and Dynamic reports
- Can’t use a database name created from a formula
- Must have the same security mode and credentials across the databases
This will be useful for those wanting to combine lots of different datasets (in different databases) onto one sheet using Planning Analytics for Excel (PAX) but rendered on PAW. For context, you can create a PAX report with data from more than one database on the same sheet, but before now it wouldn’t render properly when you pull it into PAW.
Delete a Planning Analytics Database (Cloud only)
In the last update, we saw that cloud customers could create a new database from PA Administration, bypassing the need to go through IBM Support. In a similar vein, you can now delete a database as well.
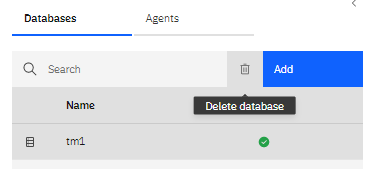
This now completes the cycle and offers the opportunity to quickly spin up a database temporarily and delete it again with ease. You’ll still need to delete the underlying data folder from the file system to remove it completely. This is only available in the new PAW experience.
Timeouts Removed?
Version 61 included a 60 minute inactivity timeout after which it logged you out of PAW. I did experience the timeouts at first but after about a week I noticed that they are no longer there. Whist this isn’t on the “official” list of improvements, I thought it worth a mention. I am quite relieved the timeouts have gone! I’m not sure why they’ve gone but can imagine it proved quite disruptive for some and maybe the change was redacted?