WHAT’S NEW IN COGNOS ANALYTICS?
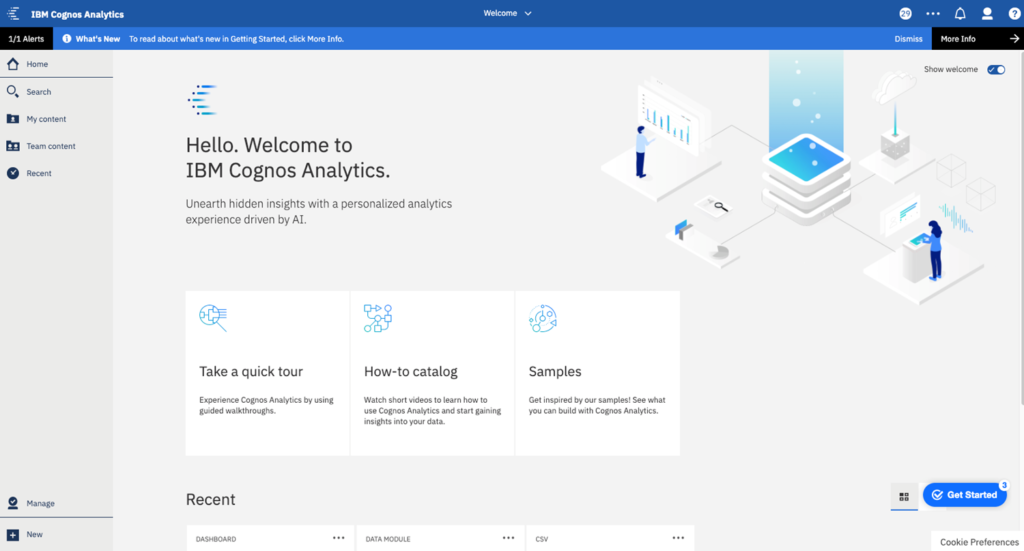
Redesigned Cognos Analytics Home Page
The new home page introduces an alerts banner, so you will get notified of maintenance announcements and information on new and changed features.
The administrator also has control over this banner, so if you want to send a message to all users, you can use this banner to do so. You can also switch your recently viewed to a list view.
Users also have quick access to how to videos and samples.
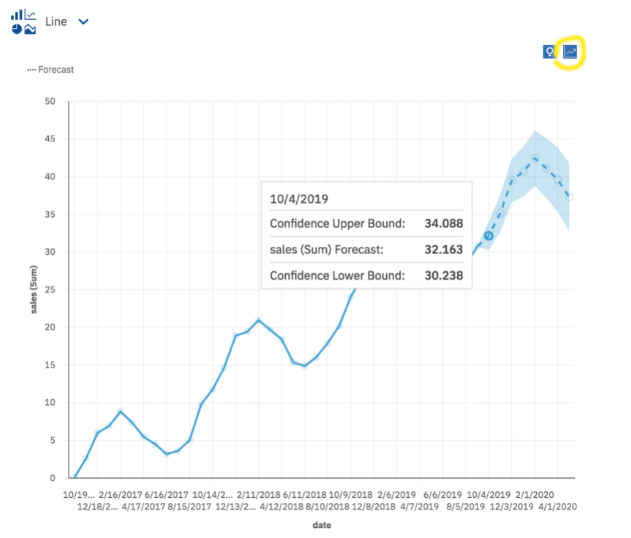
Forecasting
Forecasting has been a long-awaited request – and this release brings it to light. Build a chart, then click the forecast button to create your forecast. Cognos Analytics uses an automated set of tools to model time dependent data. It leverages a popular class of exponential smoothing models to discover and model trend, seasonality and time dependence in the data, making it applicable to a range of time series encountered in business. Automatic model selection and tuning makes forecasting easy to use, especially for users not familiar with time series modelling.
You also have access to statistical details for generated models that provide technical background information.
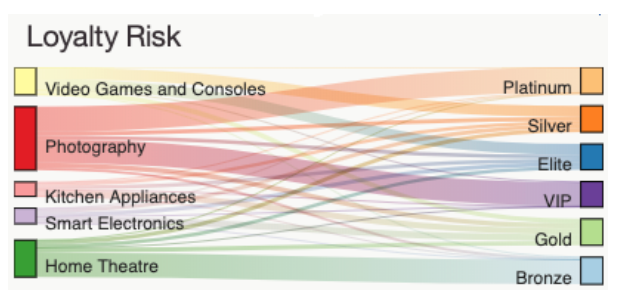
New and Custom Visualisations
There are several new visualisations and visualisation improvements that have been made within Cognos Analytics, as well as the ability to create custom visualisations!
Custom Visualisations
11.1.4 sees the addition of a new API that allows you to integrate D3 custom visualisations. D3 leverages JavaScript programming expertise.
Waterfall Chart in Dashboards
The waterfall chart is now available within a dashboard.
Improvements to Crosstabs
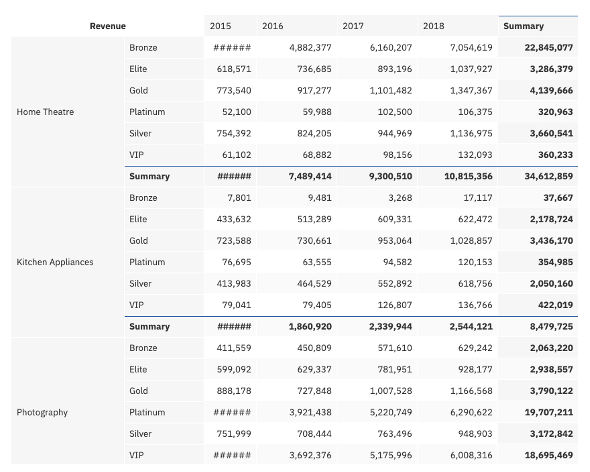
Crosstab formatting has been enhanced to improve usability and readability, and includes the following changes:
The enhancements to crosstabs and tables include the following list:
- Resize column widths and row heights
- A white border replaces the grey border
- New text formatting options such as font family, size, text colour, alignment, and styles are available on an individual row or column
- Wrap text on header rows and columns is available from the text formatting menu
- You can drag data from the selected sources pane onto a crosstab or table
Additions to Data Modules
Data modules have also seen some new additions, as well as improvements to existing features. These include:
- New join optimisation and join operators, so more flexibility when creating joins.
- The ability to have automatic model validation option.
- The Data Modules interface now includes the properties menu, the same as the other Cognos Analytics interfaces like reporting and dashboards.
- The custom grouping feature has now been improved and can be text or numeric grouping.