THINKING OF UPGRADING FROM TM1 10.2.2 TO PLANNING ANALYTICS?
HERE’S WHAT YOU NEED TO KNOW
You might be wondering why you should upgrade at all when your current TM1 installation and applications still work perfectly fine – if you are on premise that is! There are some fundamental reasons why you should upgrade, even before you start to think about Excel add ins or the new reporting tool. Firstly, if you have any issues and need defect support, you won’t be supported by IBM. You will be told that to fix the issue you need to upgrade, so there is a risk that if your application has a defect issue at an important reporting period, the time IBM spend fixing it won’t be a day or less. It will be a whole process of scoping, upgrading, migrating and testing which will take quite a bit longer to complete, meaning you don’t meet reporting deadlines.
Secondly, everyone has spent time and effort making sure that all of your business processes are GDPR compliant and ready – but have you considered the readiness of your TM1 installation? Upgrading to Planning Analytics means that your installation will be GDPR ready as well. You can find out more about GDPR in Planning Analytics local installations here, and IBM Cloud here.
What extras do you get when you upgrade?
On top of the more practical reasons, there are a number of benefits to be had from upgrading, this includes the new reporting front end tool called Planning Analytics Workspace, Planning Analytics for Excel, hierarchies and a whole host of tools and additions.
Planning Analytics Workspace
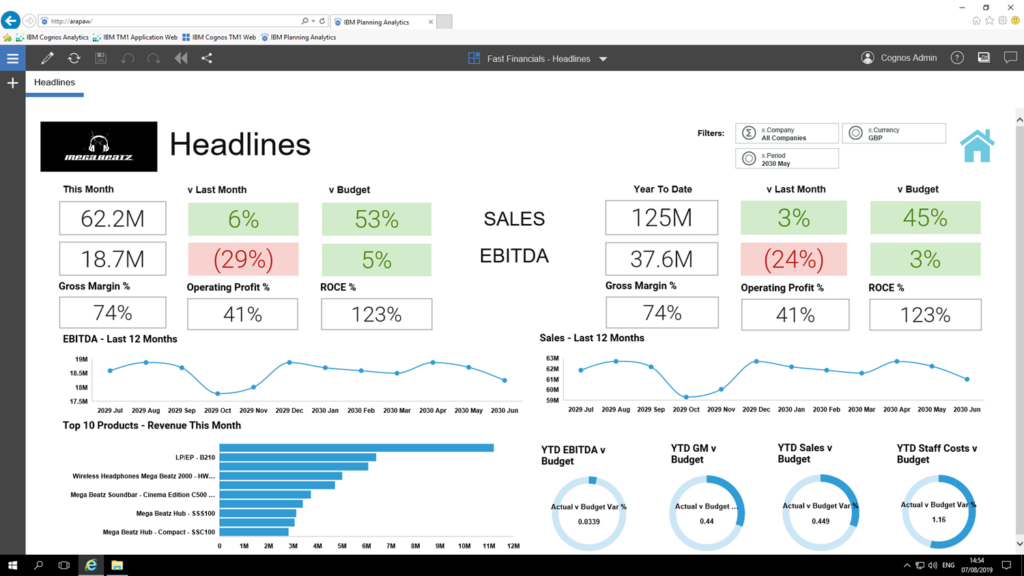
The new customisable front-end reporting and modelling tool for TM1. A web portal with drag and drop interface, modern and interactive visualisations and custom colour palettes. Planning Analytics Workspace can be used by report authors and consumers to filter on books and views, and use buttons to navigate to other content, automatically applying the filters that you have selected. Planning Analytics Workspace makes it easier to visualise your data by offering a range of visualisations (which are updated and added to frequently) including bubble, tree maps, word clouds, map visualisations, and all the standard ones you would expect.
Hierarchies
The addition of hierarchies within dimensions means you can now have alternate rollups of dimensions in the same view. A dimension can have an unlimited number of hierarches, meaning you don’t have to create a new cube if you want a new analysis dimension! For example, you may have an Organisation dimension that rolls up by region, as well as by vice-president.
Planning Analytics for Excel
Planning Analytics for Excel is the successor of Perspectives and gives easy access to your TM1 cubes directly in the Excel interface. There are a number of changes and improvements to be mentioned, but once again, this isn’t an exhaustive list!
The first difference are the report types, which include the following:
Explorations
Similar to a cube view, you can use Explorations to drag and drop dimensions in a context area and manipulate and compare your data.
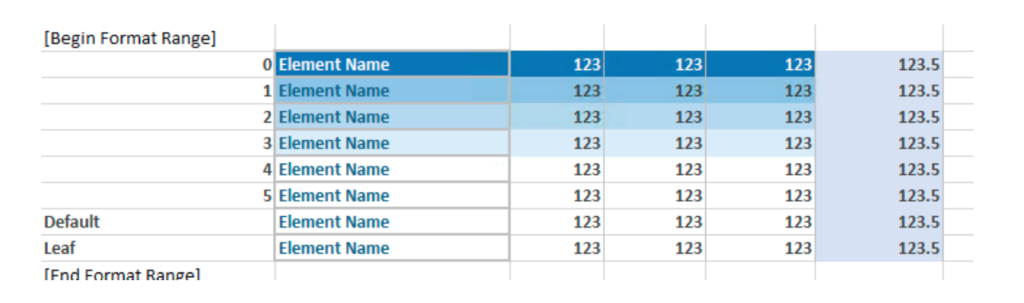
Dynamic Reports
Similar to an Active Report in Perspectives, Dynamic Reports use TM1 functions to define the report.
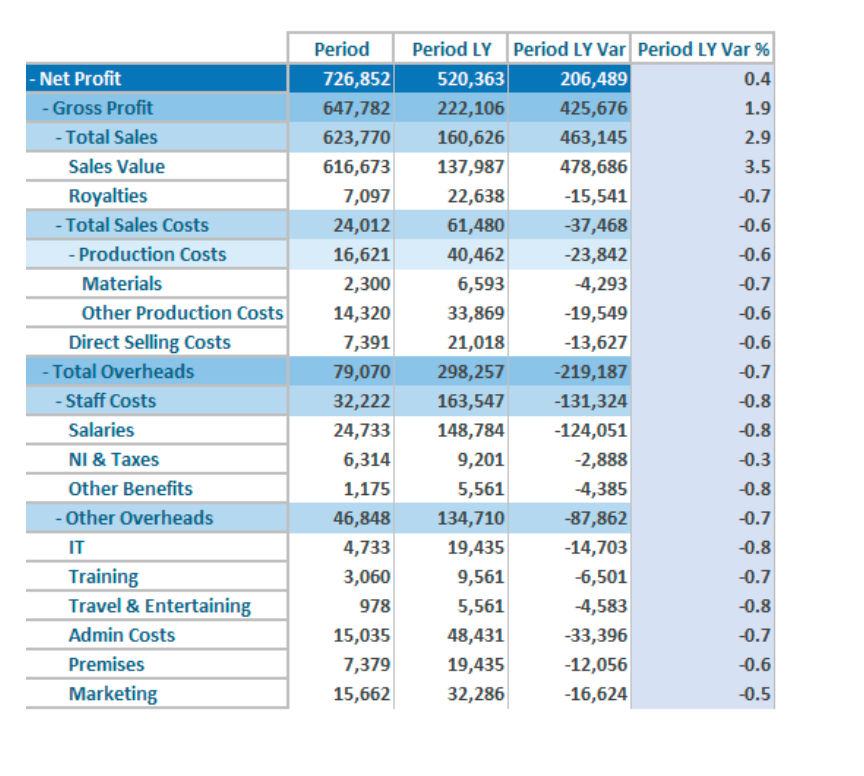
You can use Dynamic Reports to create complex reports, as well as dynamically formatted reports using the format area.
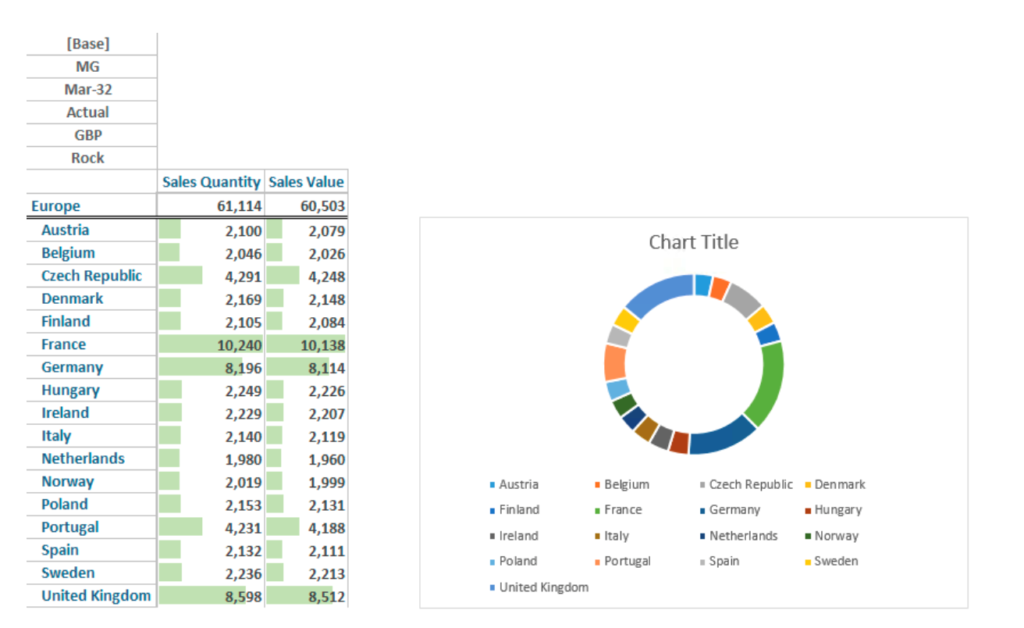
Quick Reports
In a Quick Report, you can use data from multiple sources of data and present multiple views within a sheet that use the same or different data. You can also highly format these reports and add Excel charts as below.
Custom Reports
You can create a custom report from scratch using TM1 worksheet functions to create the report, as well as use data from multiple sources.
It’s also worth mentioning you can create List Reports.
You can now publish sheets to the web as well, directly into Planning Analytics Workspace to include in your dashboards. Planning Analytics for Excel is also designed to work in a wide area network environment, which means there is no need for Citrix anymore or a similar set up, so there is much better performance when it comes to data retrieval and functions.
And a simple one, but very helpful, you can use Ctrl+c and Ctrl+v in reports!
Deployment on Cloud
You now have another option for deployment. Moving to IBM Cloud means you no longer have to worry about the infrastructure to host Planning Analytics, IBM takes care of that. Those on Cloud have access to 24/7 worldwide support, as well as high service availability and good performance.
This isn’t a definitive list of helpful new features either, you also have access to workflow, Predictive Planning, AI model building, and more. We have migrated a number of customers to the new version, both on premise and on Cloud. Recently, one of said customers said the following once the migration was complete and they have used the product for a while:
‘Planning Analytics is working well for us and we have had no issues with it since we switched over. I personally find it much easier to use than the prior version’
At Aramar, we would agree with this, and confess that our consultants now develop mostly in Planning Analytics Workspace and Planning Analytics for Excel. The new version of Planning Analytics (or the new version of TM1 should we say) really does change and improve the way our customers interact with the tool. The performance is better, and the new functions improve your capabilities as a modeler/analyst. If you are interested to know more about the effort and time involved to migrate or upgrade your TM1 installation, contact us for a chat about it.