GAME CHANGING NEW FEATURE IN COGNOS ANALYTICS 11.1.5
In Cognos Analytics 11.1.5 report authors can now visualise data on a variety of custom graphics, such as illustrations, diagrams and seating plans via a new highlight feature called schematics.
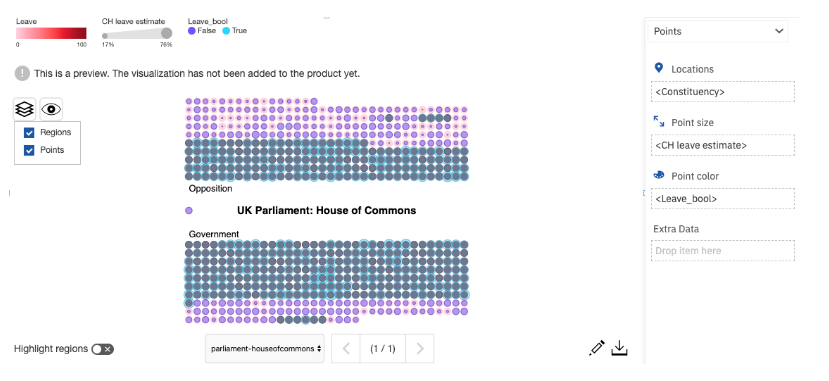
Currently available in the reporting feature, you can upload an SVG file (scalable vector graphic) as the basis for the custom graphic and then match the data to the decorations so that the values can be rendered. Example below:
Like with custom JavaScript-based visualisations released in version 11.1.4, schematic developers can build, validate and compile custom schematics into shareable assets that can be uploaded directly to Cognos Analytics. These uploaded schematics behave just like out-of-the-box visualisations with the proper permissions and governance behind it.
Report authors are able to custom filter their data to highlight areas of a visualisation of particular interest. So for example sections within a football stadium seating plan or specific components within a mechanical diagram. Powerful stuff.
Click here for a step by step guide to using schemetics in 11.1.5.
Click here for more information about what’s new in 11.1.5 reporting.
If you would like to learn more about Cognos Analytics, come join our free hands-on workshop on the 28th February at IBM Southbank.