Using Schematics to Visualise Data in Cognos Analytics
Schematics allow report authors to visualise data using custom graphics such as illustrations, diagrams, maps, and seating plans, helping bridge the gap between data and real-world layouts.
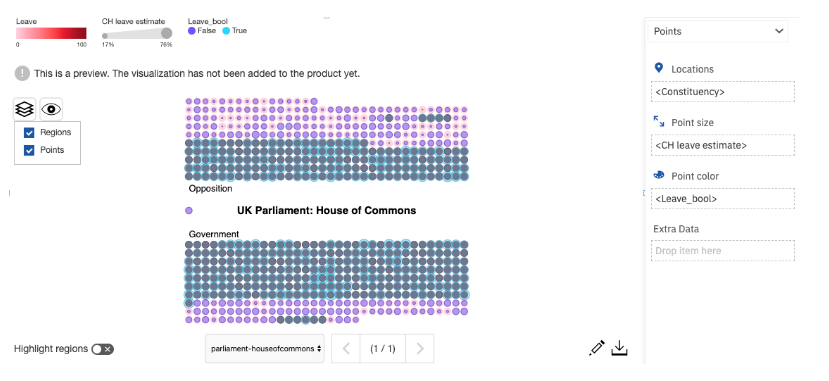
Available within the reporting capability, schematics are based on SVG (scalable vector graphic) files. Once an SVG is uploaded, data values can be mapped directly to elements within the graphic, allowing those areas to be dynamically highlighted based on the underlying data.
This makes schematics particularly effective when traditional charts or tables are not enough to communicate spatial or structural relationships, for example:
-
Highlighting sections within a football stadium seating plan
-
Visualising specific components within a mechanical or engineering diagram
-
Showing performance, utilisation, or status across a floor plan or site layout
How Schematics Work
Schematics follow the same extensibility principles used for custom visualisations.
Developers can:
-
Build, validate, and compile schematic assets
-
Package them as reusable components
-
Upload them into Cognos Analytics with full governance and permission controls
Once deployed, schematics behave like standard visualisations. They can be reused across reports and accessed by authorised users without requiring specialist setup from report authors.
Interactive, Data-Driven Insight
Report authors can apply filters and prompts to control which areas of a schematic are highlighted. This allows users to focus on specific regions, components, or areas of interest directly within the visual context.
For example, a user might filter a report to highlight only certain seating sections, asset components, or operational zones, making it easier to interpret performance or status at a glance.
Learn More
-
Step-by-step guide: Using schematics in Cognos Analytics reporting
-
Reporting overview: Reporting capabilities available in Cognos Analytics 11.1.5
- Cognos Analytics Workshops: Unlock the full potential of your Cognos Investment
Although schematics were introduced in earlier releases, they remain a flexible and valuable option for organisations looking to extend reporting beyond standard visualisations and better align analytics with physical layouts and real-world structures.