COGNOS 11.1.7 NEW FEATURE HIGHLIGHTS
IBM have just brought out version 11.1.7 of Cognos Analytics, an update which includes lots of additions, reintroduction of past functionality and changes to improve user experience. In this blog we will take you through some of the updates, this blog is by no means an exhaustive list so if you would like to know the full list of changes click here.
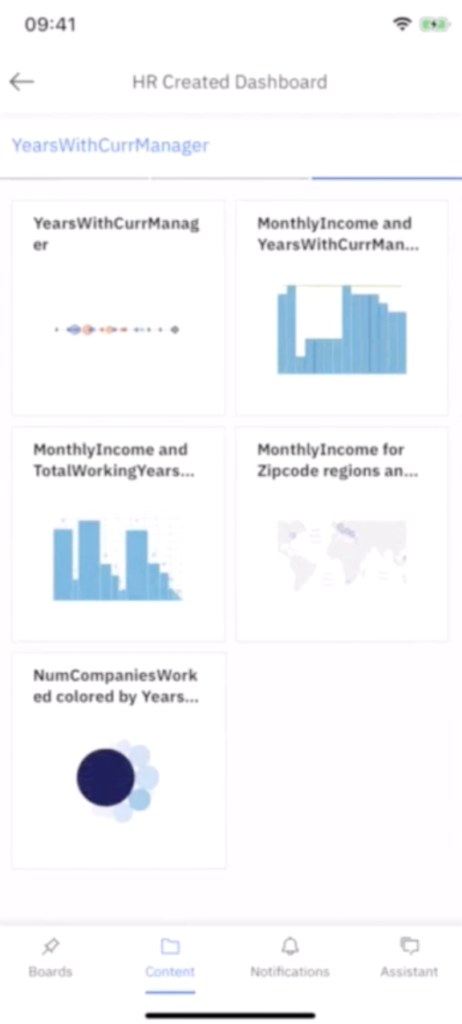
First up – the Analytics App
Lots of work has been made on Cognos mobile, with the new addition being the Analytics App. In the app, you can view dashboards on your phone by pinning your most interesting charts on your board. You can also share your dashboards this, as well as set up notifications and chat with the AI assistant to bring up insights you might be interested in.
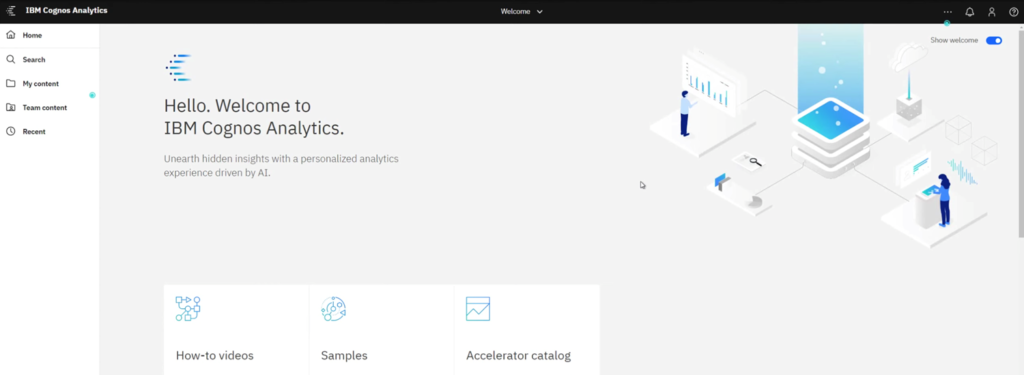
New colour theme
11.1.7 now has a new colour scheme based on the IBM carbon theme which you can see in the following screenshot, it is slightly different with a new colour scheme and different icons. Existing installations will have this theme available to choose from, but you can stick with the classic theme. Carbon design is IBM’s design language and governs much of IBM’s software.
Performance Improvements
A number of performance improvements have been put in place which has resulted in user wait time reductions and smoother rendering of animations and visualisations. Several things have happened to make this change including streamlining metadata retrieval and query planning, improved data set loading in the compute service, and a broader usage of cached data.
REST API data connector and for automation
You can now create server connections to JSON end points of web services and join REST API to other data. There are many configuration options available to accommodate various API responses and authentication. The connector is powered by Progress DataDirect Autonomous Rest technology embedded within Cognos Analytics. The REST API for automation improves integration with other apps.
Salesforce Connection
Cognos Analytics has always had a connection to Salesforce within Framework Manager, but you can now define the connection in manage – data server connections. You can also use salesforce tables directly in data modules. This connection is also available in Cognos Analytics on Demand.
Data Sets
Various improvements have taken place here, for example you can now view the generated SQL to help diagnose any issues you may have encountered (as you could in older versions). There is now also a validation option and additional out the box filters in example calendars such as current week, prior week, week to date, prior week to date, and same week last year.
Visualisations in Reports
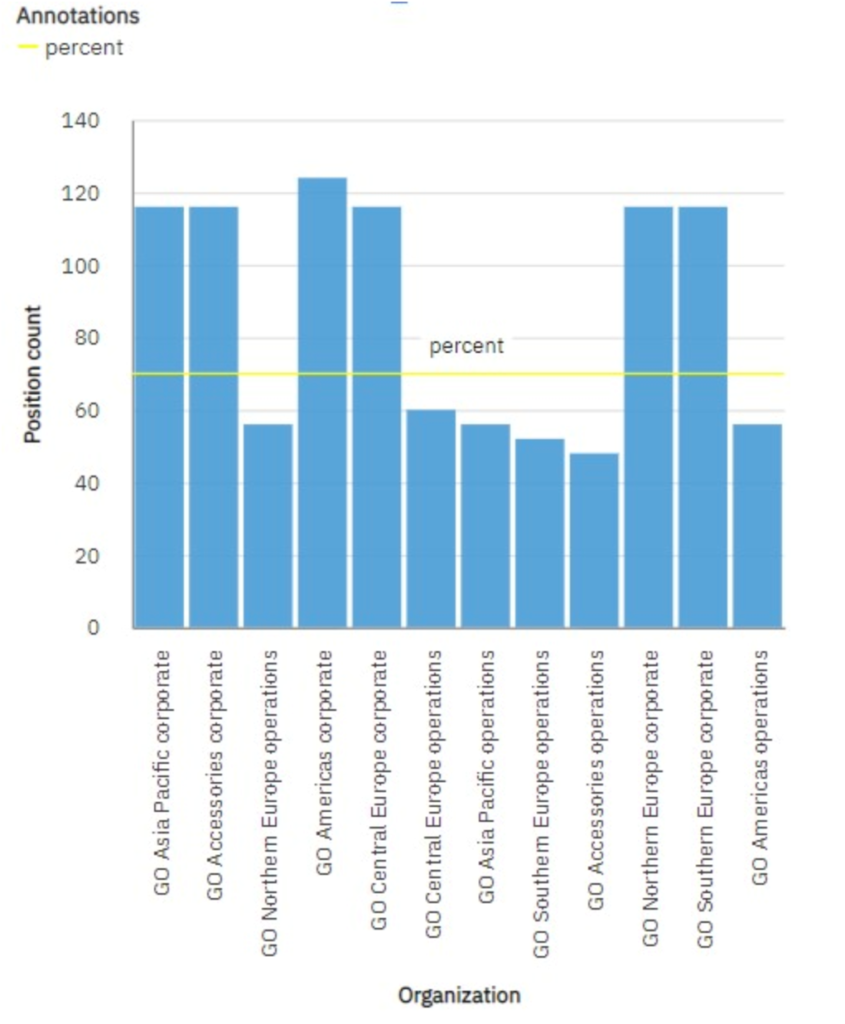
You now have the ability to add extra and multiple baselines into your charts, a long-awaited feature for many users!
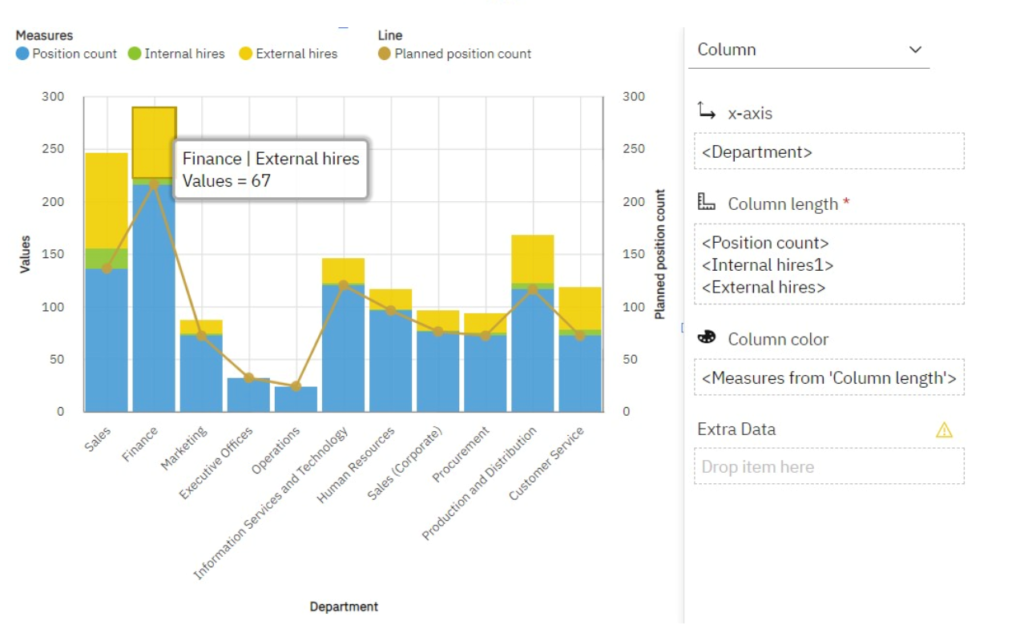
Combination chart improvements have taken place so you can have multiple series, measure groups, separate palettes for each chart and flexible combinations of line interpretations with clustered, stacked, column or bar charts.
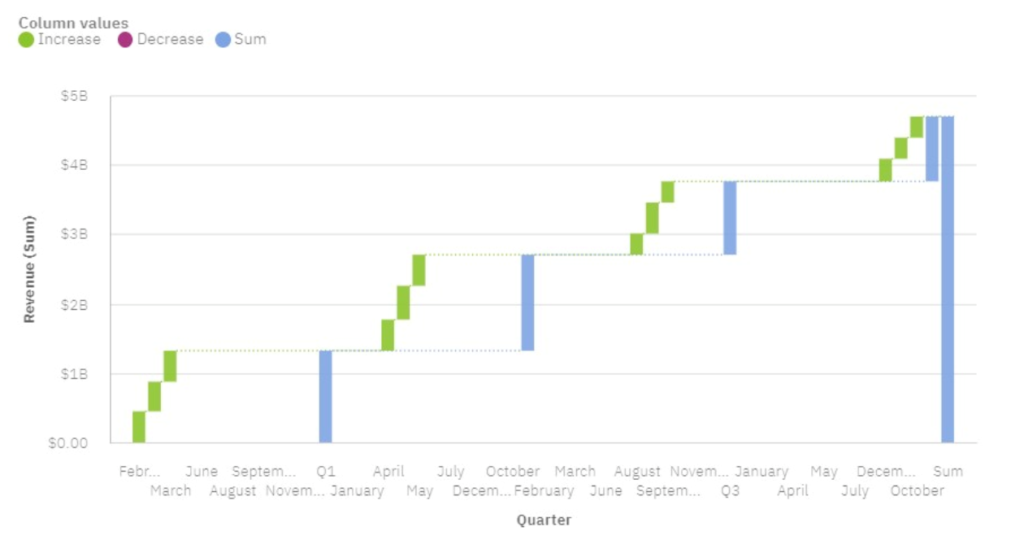
There have also been improvements to waterfall charts, including an additional categorization slot, more axis range control and measure groups. Baseline is also now available on waterfall charts as well, and you also have control over the zero origin. You can now also use subcategories in waterfall visualisations to display how categories are built up. For example, you can see the revenue of each month contributes to quarterly totals:
You’ll also see Treemap improvements like different display modes, more customisation on label orientation in pie charts, and 11.1 visualisations can now be displayed in the body of an email.
Dashboards
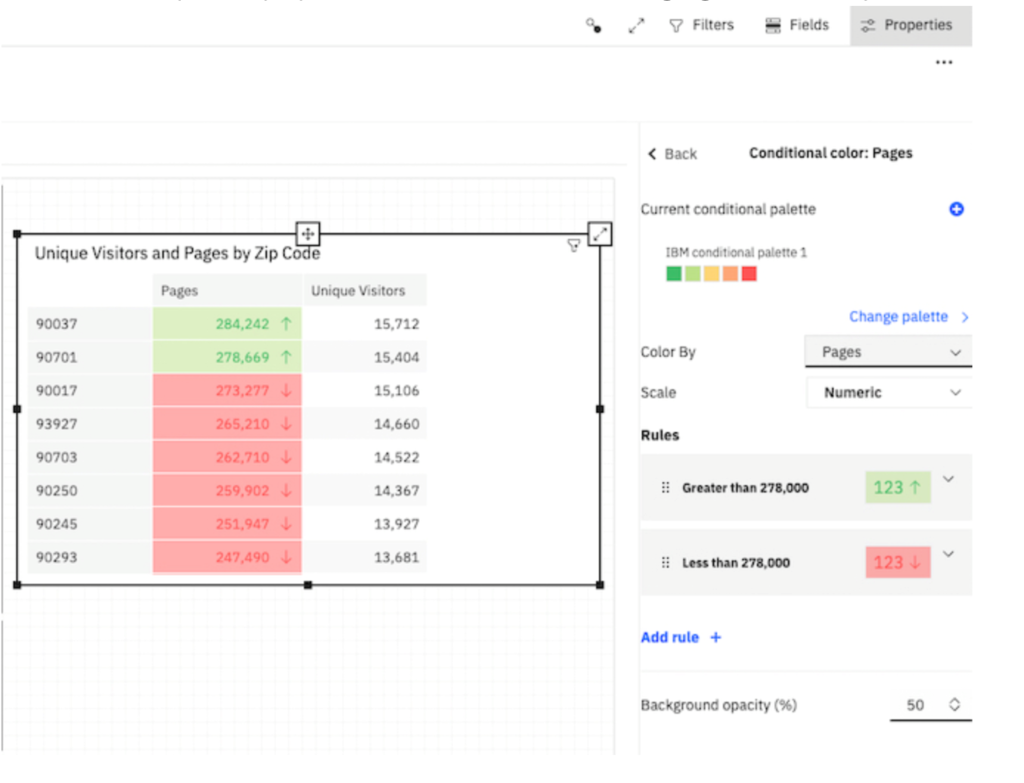
You can now use conditional formatting in crosstabs in dashboards so you can define colour cells based on your metrics:
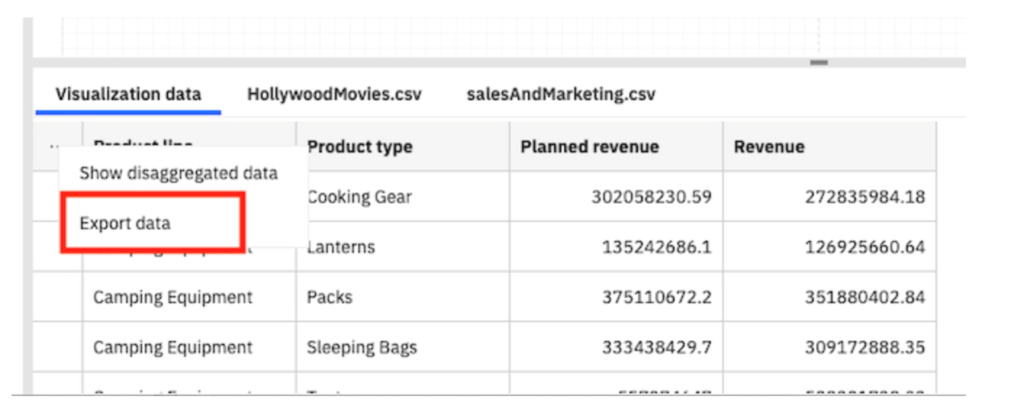
As well as export visualisations to csv:
Data Modules
You now have access to the 4-5-4 American retail calendar format. Coming soon will also be a very handy guide to modelling best practices, plus Framework Manager and Data Manager gaps and guidance documentation. This should be very helpful to modelers!
IBM have also redesigned the scheduling interface, which includes a search functionality to make things easier to find and save as a report view option.
Cloud connection to Planning Analytics
In 11.1.7, the constraints between connecting Planning Analytics and Cognos Analytics have been removed on the Cognos Analytics side, with the roadblocks on the Planning Analytics side to be following shortly – so watch this space!